|
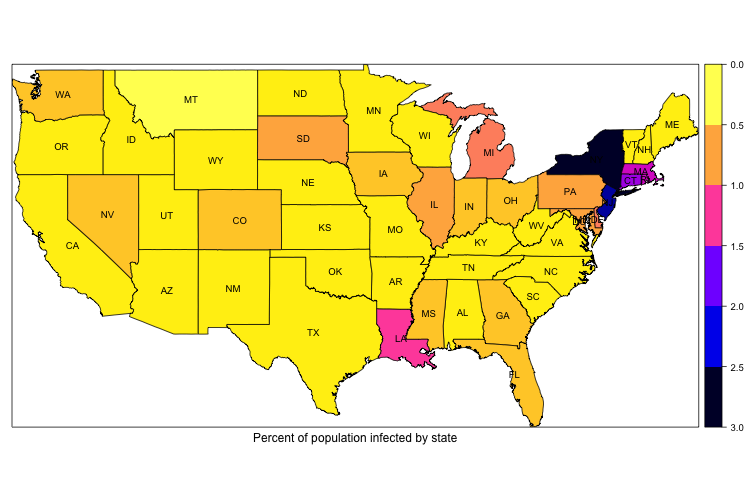
The COVID-19 pandemic has caused huge disturbance to human life. One major uncertainty is related to the question, how many or what percentage of people who have been infected? There are published and frequently updated statistics related to the pandemic, at local, country or global level, however, such data are often highly incomplete and many cases were not included in those reported numbers. We propose a structured approach to the estimation of the number of hidden cases and thus the percentage of population infected. By our estimate, the number of infected cases in the US is roughly double of the reported number. The overall infection ratio for the US is 0.53% (as of Apr 20, 2020), and a case mortality rate at 2.85% which is close to the suggested 3.4% by the WHO. The top figure shows the infection ratio by states in the US.
|
|
|
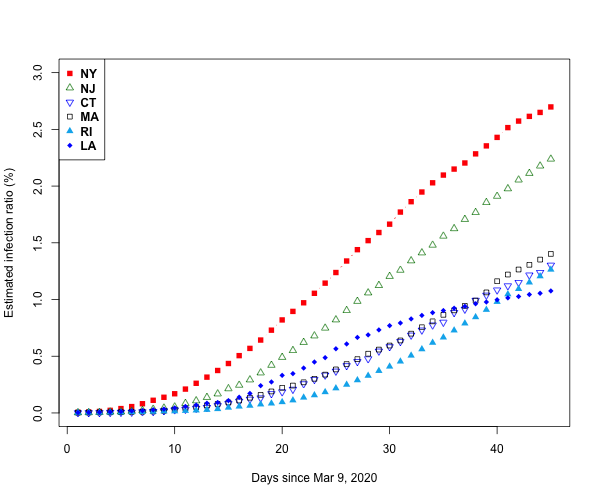
The estimated infection ratio for the 6 most heavily hit states, including NY, NJ, MA, CT, RI, and LA, is shown in the figures on the left. The figure reveals that while NJ and NY have a similar growing trend, the growing pattern for the 3 New England States, CT, RI and MA, are very similar, and LA has a different pattern. The infection ratio (as of Apr 20, 2020) for NY is estimated as being over 2.5% and NJ over 2.0%, while MA, CT, RI and LA are between 1.0-1.5%.
|