Octave-MATLAB Examples
Examples
Plotting Tools
-
contourPlot(Finline, xMin, xMax, yMin, yMax, Clist, n)
An M-file function that automates plotting contours such as those below:
\( (x^{2} - 1)(y^{2}-1) = C \)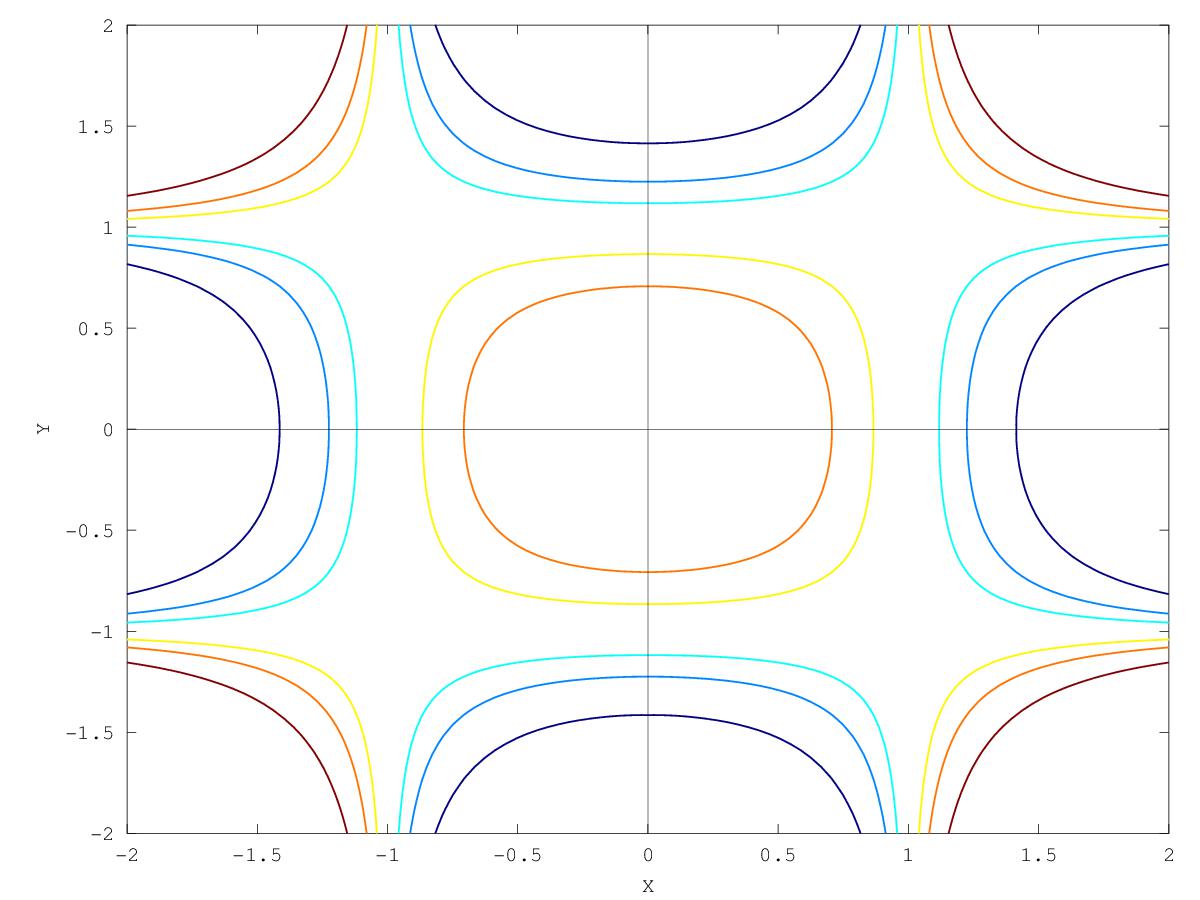 \( x \cos y - y \cos x = C\)
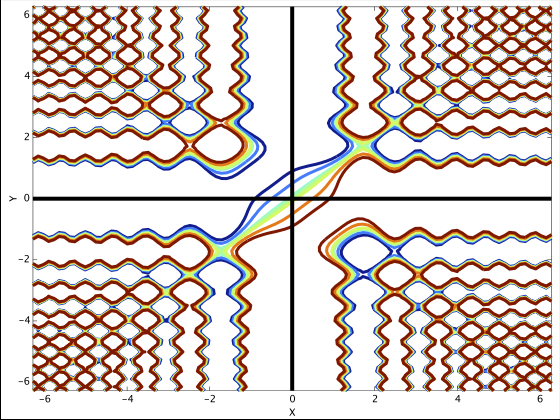
-
integralPlot(Finline, x0, xMin, xMax, n, plotFtoo)
An M-file function that automates the plot of an integral of a function:
\( y(x) = \int_{1}^{x}{\frac{\sin t}{t} dt} \)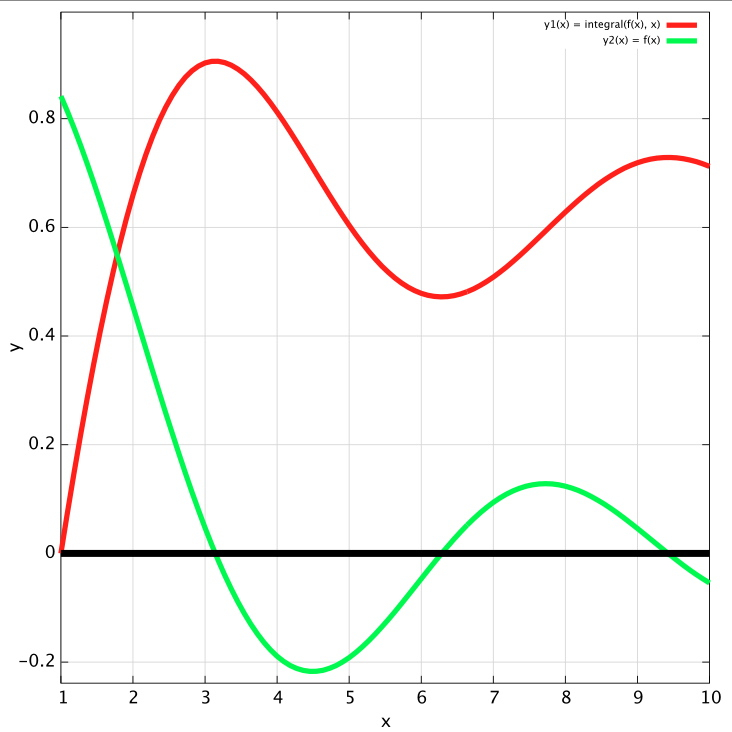 \( y = \int_{1}^{x}{\frac{1-\cos x}{x} dt} \)
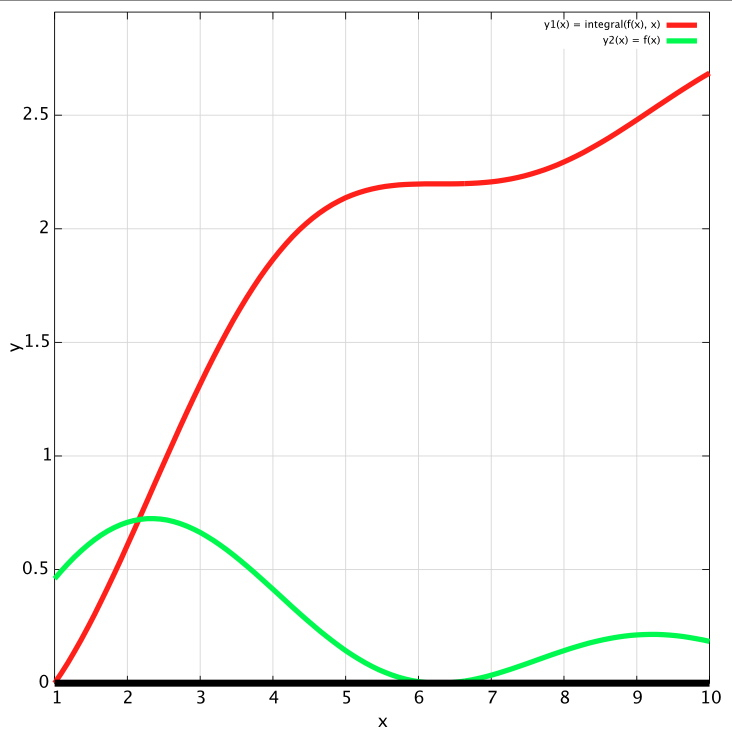
-
directionFieldPlot(dydxInline, xyMin, xyMax, nXY, useArrows)
An M-file function that automates the direction field plot of a first-order ODE such as those shown below:
\(\frac{dy}{dx} = y(4-y^{2}) \)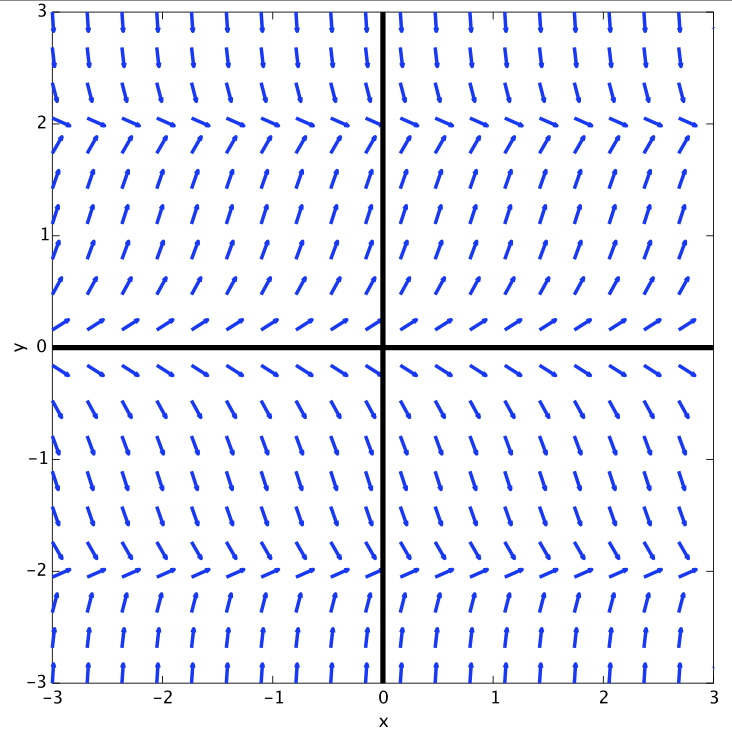 \(\frac{dy}{dx} = -\frac{x}{y} \)
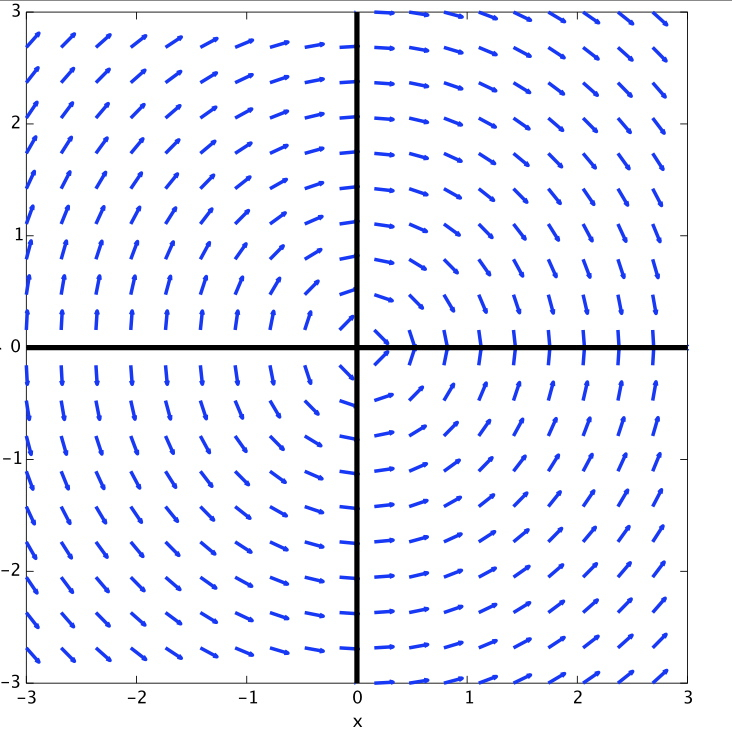
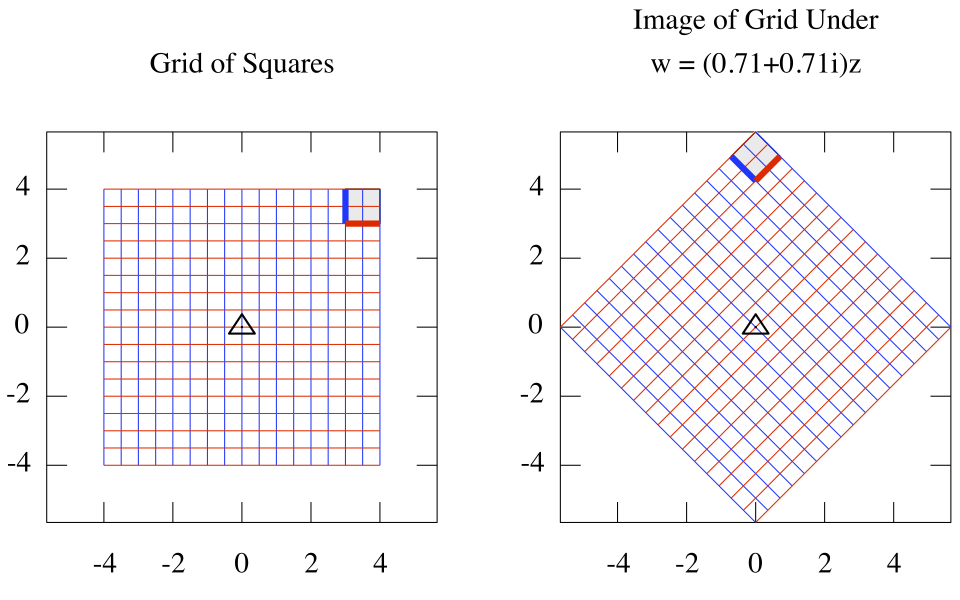
Conformal Maps of the Complex Plane
-
Image of a Square Grid under \(w = Az\)
-
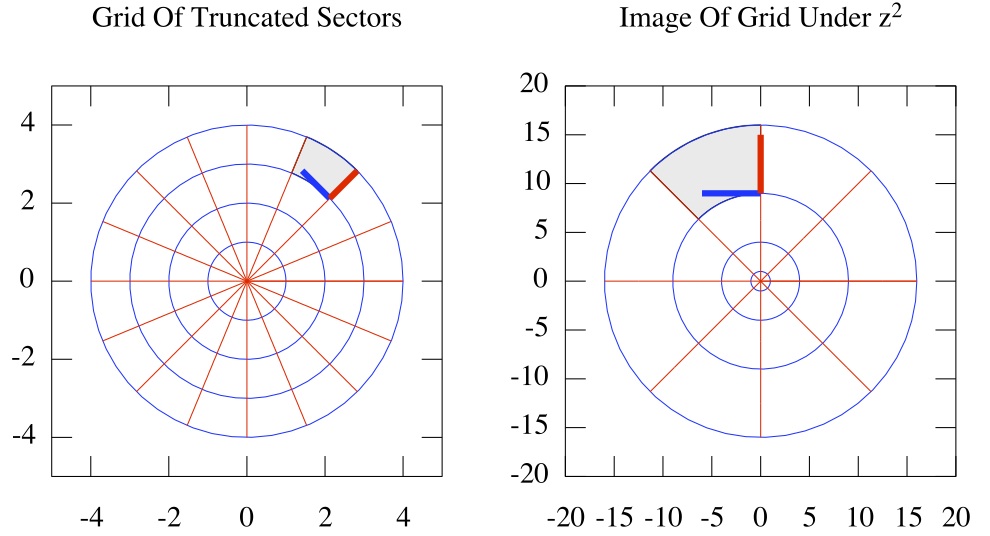
Image of a Circular Grid under \( w = z^{2}\)
-
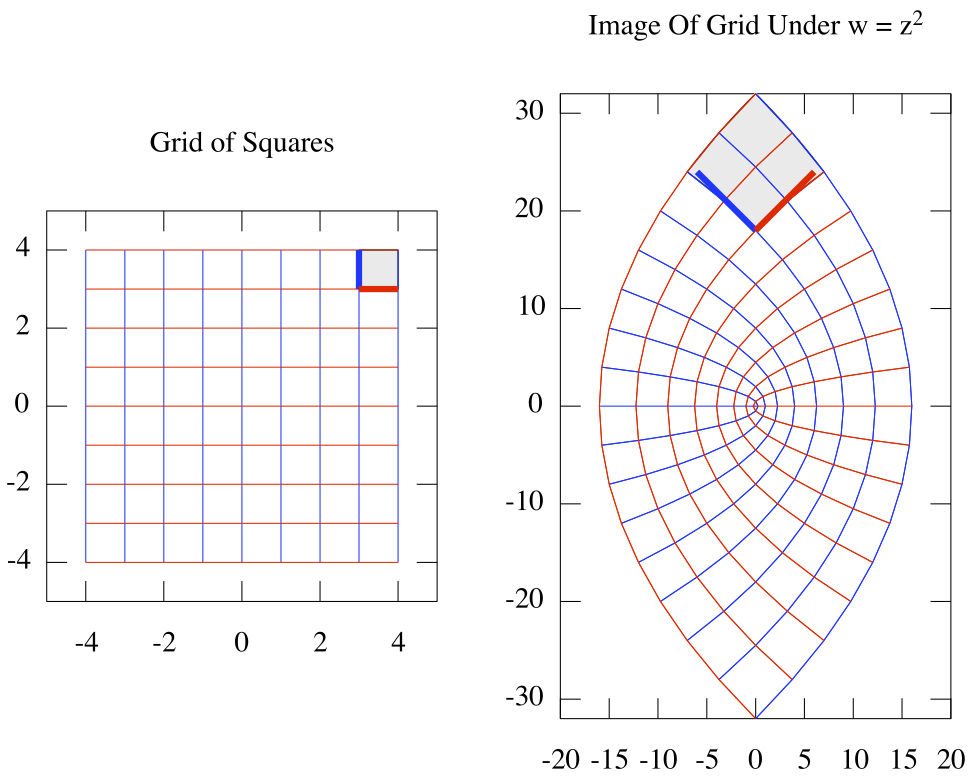
Image of a Square Grid under \( w = z^{2}\)
-
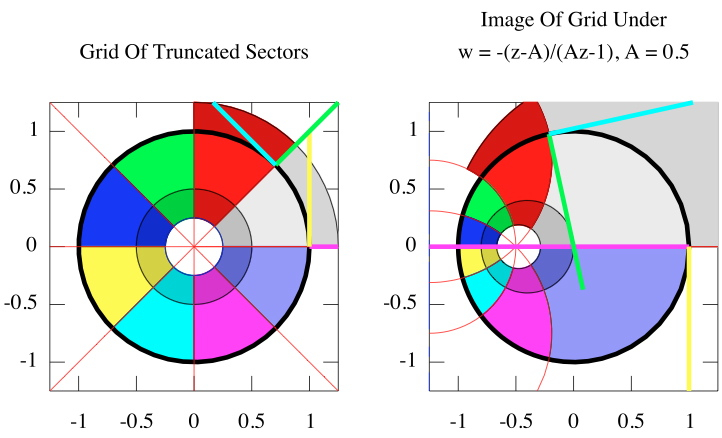
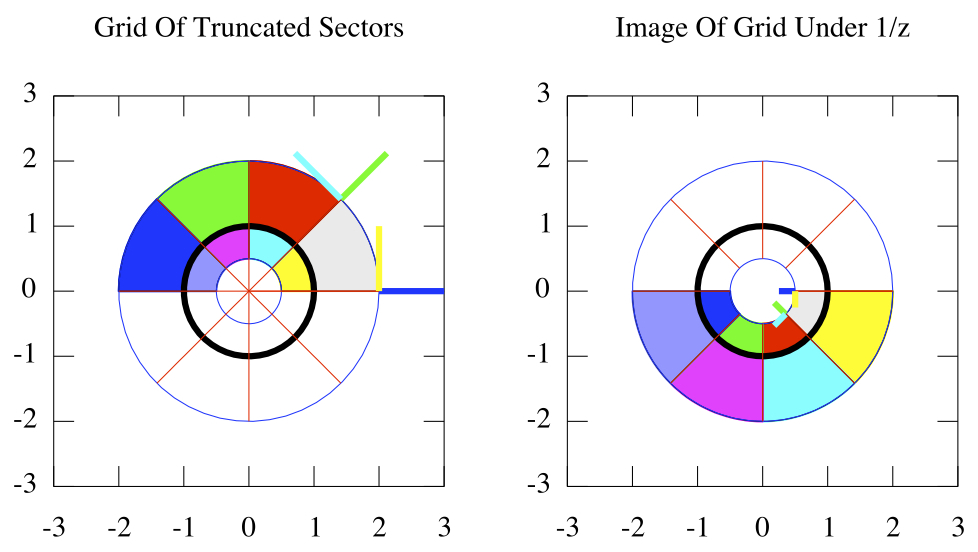
Image of a Grid of Truncated Sectors under \( w = \frac{1}{z} \)
-
Image of a Grid of Truncated Sectors under the Mobius Map \( w = -\frac{z-0.5}{0.5z-1}\)